The Trailer: The seven political states of Pennsylvania
Fifth in a series on swing states
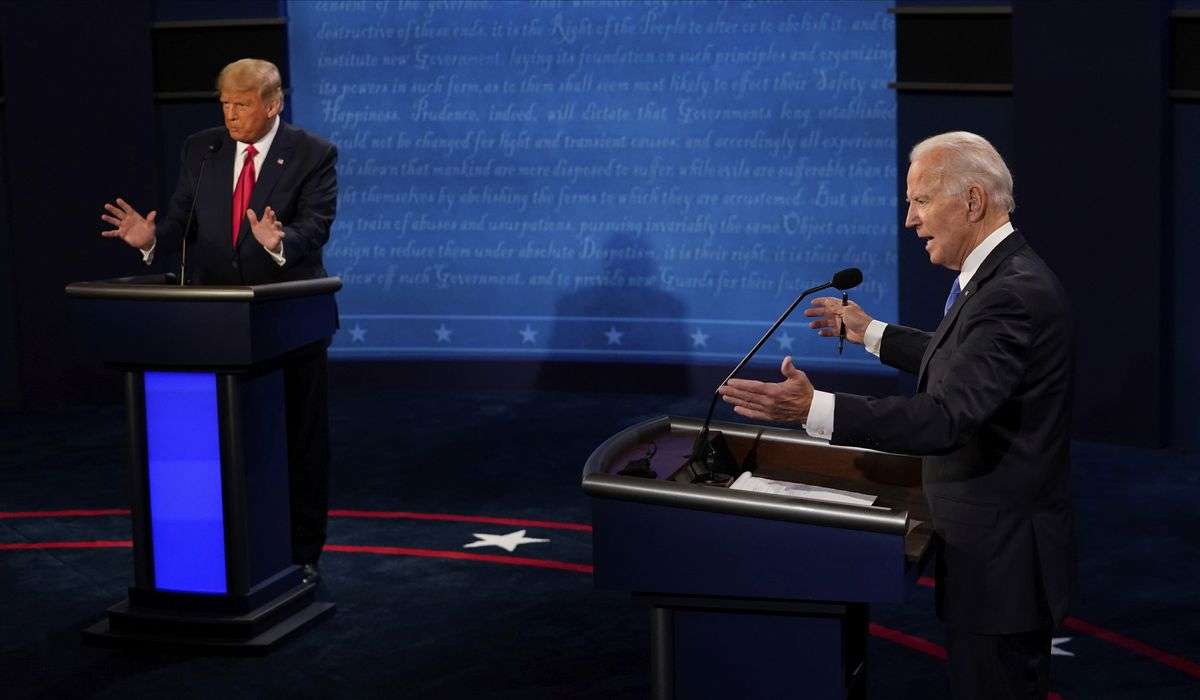
After losing the presidency in 2016, Democrats had a few excuses for their weak performance in the upper Midwest. Hillary Clinton had barely campaigned in the Great Lakes region, outside of Ohio; she had held back campaign resources, as her data suggested such states as Michigan and Wisconsin would remain part of a “blue wall.”
None of those rationales made sense for Pennsylvania, a state Clinton tended to for months and where she buried Donald Trump in TV advertising. Democrats bet on a few trends that simply did not materialize, like a suburban vote surge overwhelming losses in rural areas, and suburban women jumping — maybe at the last minute — for the chance to elect a female president. Clinton ended up losing the votes of White women by nine points, according to exit polls, and losing the suburbs by four points. Meanwhile, voters without college degrees, who had backed Barack Obama’s 2012 bid by 15 points, went for Trump by seven points.

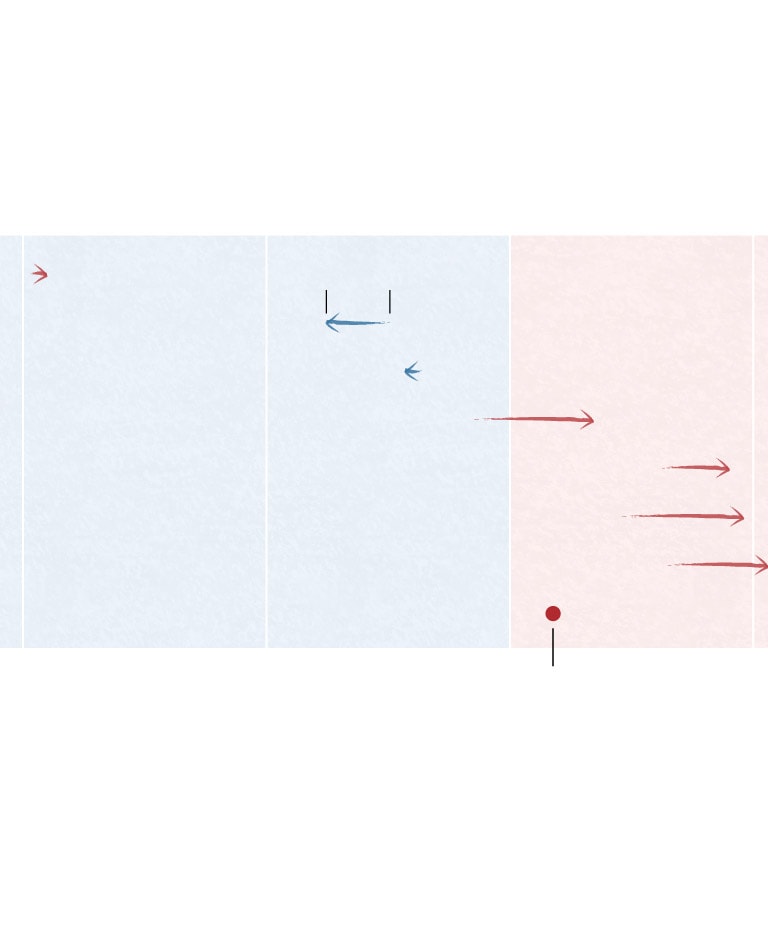
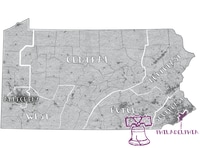
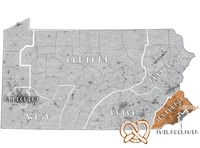
Penn.’s shift from 2012 to 2016
Trump gained in most of the state, but especially in rural regions.
Dem. won by
500k votes
GOP won
by 250k
Philadelphia
Statewide 2016 margin
In 2018, Democrats swept statewide races and picked up House seats, with Republican nominees for governor and U.S. Senate holding on to rural areas while the vote in suburban Philadelphia, northeast Pennsylvania and Erie County swung back toward Joe Biden’s party.
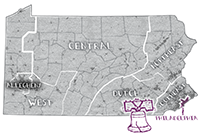
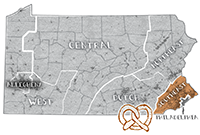
Pennsylvania’s shift from 2012 to 2016
Clinton outperformed Obama in Southeast but Trump gained almost everywhere else, especially rural regions
Dem. won by
500k votes
GOP won
by 250k
Philadelphia
Statewide 2016 margin
In 2018, Democrats swept statewide races and picked up House seats, with Republican nominees for governor and U.S. Senate holding on to rural areas while the vote in suburban Philadelphia, northeast Pennsylvania and Erie County swung back toward Joe Biden’s party.

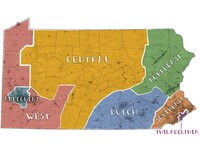
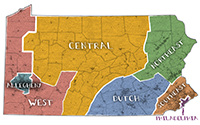
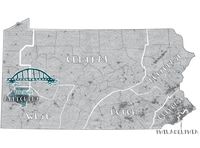
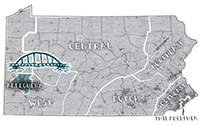
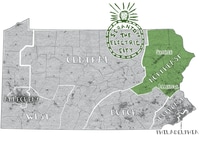
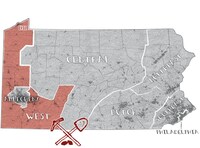
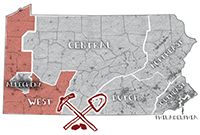
Pennsylvania’s shift from 2012 to 2016
Clinton outperformed Obama in Southeast and Allegheny, but Trump gained everywhere else, especially rural regions
Dem. won by
500k votes
GOP won
by 250k
Philadelphia
Statewide 2016 margin
In 2018, Democrats swept statewide races and picked up House seats, with Republican nominees for governor and U.S. Senate holding on to rural areas while the vote in suburban Philadelphia, northeast Pennsylvania and Erie County swung back toward Joe Biden’s party.
On the county-by-county map beloved by the president, the vote shift is hard to detect. Trump won three counties (Erie, Luzerne, Northampton) that were carried by the 2012 Obama-Biden ticket; Clinton won one county, Chester, that the party had lost four years earlier. That obscures the scale of Republican gains, which turned places that Obama had lost by a few points into places where Clinton lost by landslides.
In 2018, Democrats romped back and swept Pennsylvania’s statewide elections, but some of these voters didn’t come back. Even Sen. Robert P. Casey Jr. (D), the scion of Scranton’s most successful political family, watched his vote share decline in Northeast Pennsylvania. Statewide, his margin from 2012 to 2018 grew from 10 points to 13 points. But instead of narrowly winning Philadelphia’s outer suburbs, he won them in a rout; instead of romping in the Northeast, he fought to a draw.
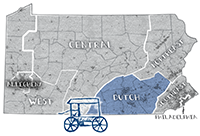
We’ve split Pennsylvania into seven states — or, if you must get technical, seven commonwealths. Democrats turn out big margins in three of them: the urban centers of Allegheny and Philadelphia counties, and the populous suburbs of the Southeast. Three other regions were red before 2016 and got redder: the West, conservative Central Pennsylvania and the Dutch Country around Harrisburg and Lancaster. The key swing region is the Northeast, from Allentown to Scranton to the deeply conservative townships of Wayne and Pike counties.
This is the fifth in a series breaking down the key swing states of 2020, showing how electoral trends played out over the past few years and where the shift in votes really mattered.
Philadelphia
A myth has developed about Philadelphia’s role in the 2016 election — the myth of lower turnout. Pennsylvania’s biggest city gets lumped in with Milwaukee or Detroit, places where a drop in Black voter enthusiasm was decisive in Trump’s Midwest victory. But the Clinton campaign actually held its own in Philadelphia, running fewer than 5,000 votes behind Obama’s 2012 campaign. No other Democrats, in modern history, had gotten such a massive margin out of the city, even as Trump ran a few thousand votes ahead of 2012 Republican presidential nominee Mitt Romney.
Heading into this election, Democrats are less worried about turning out their vote than they are about the Republican effort to supplement its usual poll watchers with election monitors from outside the city. (The GOP is in court to make that happen, while Democrats fret about rural voters arriving to slow down in-person voting with challenges.) There are pockets of Republican support in the northeastern part of Philadelphia County, and the campaign may play more for working-class White voters here, after the Democratic Party’s left triumphed in local elections and changed the city’s approach to policing.
2016 vote totals
- Donald Trump: 108,572
- Hillary Clinton: 584,016
Counties included: Philadelphia
Allegheny
When the president pulled the United States out of the Paris climate accord, he invoked Pennsylvania’s steel city as the reason. “I was elected to represent the citizens of Pittsburgh,” Trump said. “Not Paris.” Pittsburgh’s Democratic mayor, Bill Peduto, fired back by committing the city to international climate standards. Trump had been electorally obliterated in Pittsburgh, winning fewer votes than Romney, and the city has moved further to the left since then, with Democrats seizing on the Tree of Life synagogue shooting of 2018 to argue that the president has incited hatred and violence.
Democratic presidential nominee Joe Biden has politically tended to Pittsburgh for ages, jogging through the city’s Labor Day parade and giving two of his campaign’s major speeches there: his first address as a candidate last year and his Aug. 31 remarks about civil unrest. The president is politically toxic in the city itself and weak in its closest suburbs, but Clinton improved on Obama’s margin here by fewer than 20,000 votes. Biden is playing for a landslide, and getting one would minimize his losses up and down Interstate 79.
2016 vote totals
- Donald Trump: 259,590
- Hillary Clinton: 367,369
Counties included: Allegheny
Southeast
Democrats can recall Senate Minority Leader Charles E. Schumer’s theory word for word, and with a lot of pain: “For every blue-collar Democrat we lose in western Pennsylvania, we will pick up two moderate Republicans in the suburbs in Philadelphia.” Tone-deafness aside, Schumer’s math was off. Clinton did blow away previous Democratic margins in the suburbs of Philadelphia, but Trump held onto more Republicans than Clinton expected, something she credited to the FBI’s 11th-hour probe of an aide’s laptop to check for more of her emails.
Republicans have lost ground in the region only since 2016, losing their historic registration advantage, losing control of local governments, and giving up two House seats after a 2018 court-ordered redistricting. (Moderate Republican Rep. Brian Fitzpatrick narrowly held onto the Bucks County seat but has one of the least Trump-friendly voting records in his party.) The most rural parts of the region moved toward the GOP, but suburbs surged toward Democrats, with the party’s 2018 ticket winning each county by double digits.
2016 vote totals
- Donald Trump: 553,758
- Hillary Clinton: 742,365
Counties included: Bucks, Chester, Delaware, Montgomery
Northeast
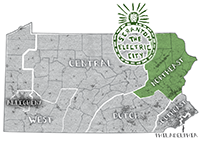
If Democrats lost the 2016 election in one part of Pennsylvania, it was here, and they hardly saw it coming. Clinton’s suburb-centered campaign spent little time in working-class White towns that had always supported Democrats. The Trump campaign, which had watched then-Rep. Lou Barletta turn his part of the region red by cracking down on undocumented immigrants, made a serious play here. The result was the biggest regional flip in the state, with a roughly 36,000-vote margin for Obama in 2012 turning into an approximately 86,000-vote margin for Trump — enough all by itself to turn the state red.
Much of the movement came in Luzerne County, where the city of Wilkes-Barre stayed blue but the townships around it surged toward the GOP. Democrats won it back in 2018, improving throughout the region, but Trump’s protectionist trade messaging and anti-establishment positioning was perfect for towns and cities that had been told for decades that someone was coming to reverse their decline. Scranton’s Lackawanna County stayed blue, but only by a hair; in 2012, the Obama-Biden ticket won it by 27 points.
2016 vote totals
- Donald Trump: 422,590
- Hillary Clinton: 336,845
Counties included: Carbon, Lackawanna, Lehigh, Luzerne, Monroe, Northampton, Pike, Schuylkill, Susquehanna, Wayne, Wyoming
Dutch Country
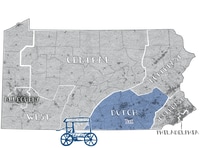
George W. Bush never carried Pennsylvania, but it was his reelection campaign that first realized how many more Republican votes were obtainable in Dutch Country and the region around the state capital of Harrisburg. Bush added 30,000 votes to his total in Lancaster County from 2000 to 2004, and not even Trump has matched that performance since. But Democrats learned the hard way, with Trump, that social conservatives were just as happy voting for a brash, thrice-married New Yorker as they were voting for a traditional family man.
Across the region, Trump improved the GOP margin from more than 156,000 votes to more than 225,000 votes, winning everything outside of the small cities, like Harrisburg, York, Lebanon and Lancaster. Democratic Gov. Tom Wolf, who lives in York, cut those margins in his 2018 reelection but still lost the region. Democrats are also competing seriously for the 10th Congressional District, which backed Trump by nine points in 2016 but reelected Republican Rep. Scott Perry in 2018 by just three points — a potential hint at how Democrats can bid for voters in a conservative region that doesn’t rely on energy exploration for economic growth.
2016 vote totals
- Donald Trump: 630,294
- Hillary Clinton: 404,959
Counties included: Adams, Berks, Cumberland, Dauphin, Franklin, Lancaster, Lebanon, Perry, York
Central
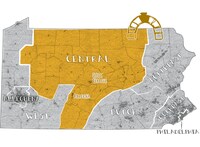
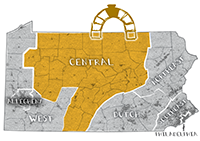
Thirty-six years ago, when James Carville helped elect Robert P. Casey Sr. as governor in a tight race, he summed up the commonwealth this way: “Between Paoli and Penn Hills, Pennsylvania is Alabama without the Blacks.” Democrats and Republicans have paraphrased that ever since, to explain the turnout war between the red rural “T” that connects Pittsburgh to Philadelphia. It was red before Trump ran, but he made it redder, adding more than 120,000 Republican votes as Democratic turnout stayed flat.
Across the region, only Centre County, home to Penn State University, leans toward Democrats, and the party’s win margin comes entirely from the borough of State College. That advantage might be hampered by the pandemic, which has stranded many students off campus and made traditional Democratic campaigning at universities impossible. There are no similar problems for Republicans, who were excited enough about Trump in 2016 and now have four years of antiabortion, pro-Second Amendment, pro-fracking policies to run on. The only questions are about the size of the coming Trump landslide here.
2016 vote totals
- Donald Trump: 448,048
- Hillary Clinton: 182,955
Counties included: Armstrong, Bedford, Blair, Bradford, Cameron, Centre, Clarion, Clearfield, Clinton, Columbia, Elk, Forest, Fulton, Huntingdon, Indiana, Jefferson, Juniata, Lycoming, McKean, Mifflin, Montour, Northumberland, Potter, Snyder, Sullivan, Tioga, Union, Venango, Warren
West
Twenty years ago, Al Gore swept every county in southwestern Pennsylvania, and an antiabortion Democrat from the region was the party’s nominee for Senate. Republicans have gained ground in the region ever since, as conservative Democrats were swept out of local offices, and pro-coal, pro-gun messaging became even more associated with the GOP. By 2016, as noted above, national Democrats were literally writing it off. But they thought they could do so, because they were winning elections without it.
The party won back some ground in 2018, but not much; even Rep. Conor Lamb, who won an old district cutting through the region, lost every county and was elected thanks to his strength in Pittsburgh’s closest suburbs, in Allegheny County. But he reduced the GOP’s win margins to the levels they’d won by in 2008, and a Biden performance at that level would complicate the Republicans’ statewide strategy. For a Democrat, losing the region by 110,000 or so votes, as Obama did in 2012, was survivable; losing it by 240,000 votes, as Hillary Clinton did, was not.
Biden, one of very few national Democratic Party figures who campaigned for Lamb, has stayed close to him, and has tailored his position on fracking — no ban but no new fossil fuel exploration on federal land — to the region. Local Democrats remain nervous that Biden has not campaigned in Erie County, which moved to Trump in 2016, and that he has not done more to combat the false accusation that he would “ban fracking.” On Aug. 31, when Biden came to Pittsburgh and denounced a fracking ban, his eyes were on the region outside the city. When he campaigned in Latrobe’s Westmoreland County a few days later, Trump was thinking about the same thing.
2016 vote totals
- Donald Trump: 547,551
- Hillary Clinton: 307,559
Counties included: Beaver, Butler, Cambria, Crawford, Erie, Fayette, Greene, Lawrence, Mercer, Somerset, Washington, Westmoreland