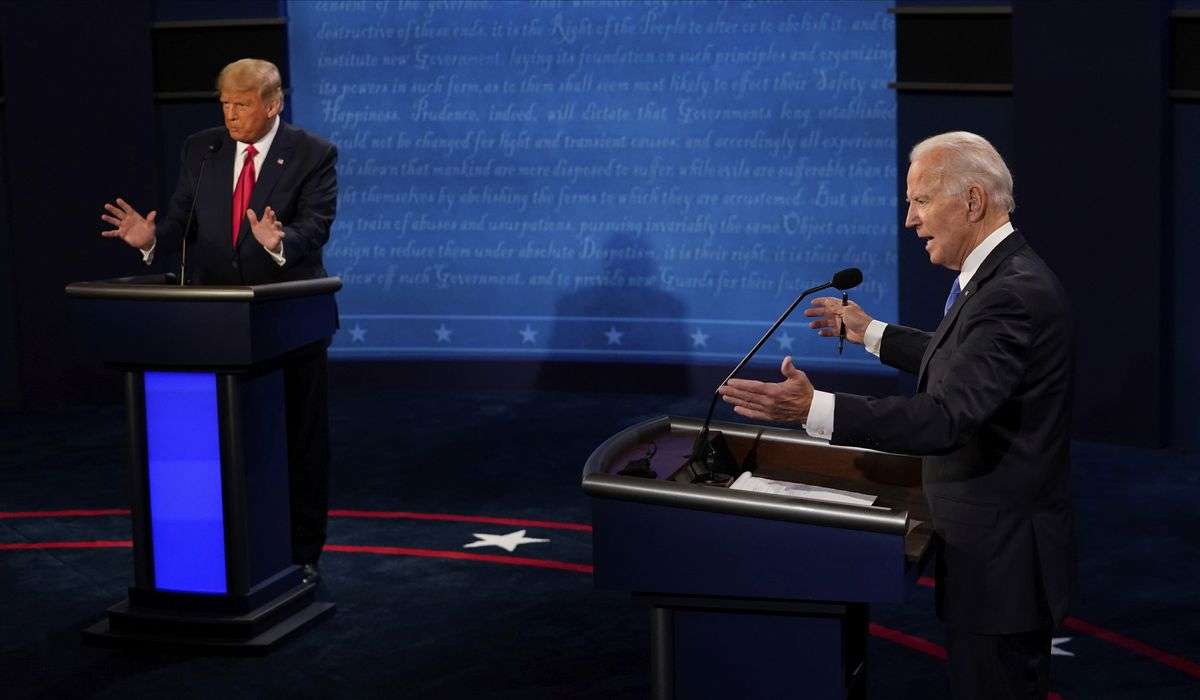
How much did Trump’s presence on the ballot warp 2016 and 2020 polling?
Shortly before the 2016 election, I noticed two things that I didn’t combine fast enough to reshape my expectations. The first was that undecided voters (of which there were a lot) were shifting to Trump, something that was observable in late polling. The other was the legitimate groundswell of support for Trump that I saw in Scranton, Pa., in the last weekend, including a number of voters who told me that they didn’t usually bother to vote. That latter observation has lingered, particularly in the context of the polling question.
Were the misses in 2016 and 2020 largely a function of people who don’t usually vote coming out to cast a ballot — and not bothering to do so in 2018?
A new analysis of why polls missed the mark in 2020 from a group of Democratic pollsters includes that possibility.
“Among low propensity voters — people who we expect to vote rarely — the Republican share of the electorate exceeded expectations at four times the rate of the Democratic share,” the pollsters wrote in an essay describing their analysis. “This turnout error meant, at least in some places, we again underestimated relative turnout among rural and White non-college voters, who are overrepresented among low propensity Republicans.”
Later, they put a fine point on it.
“[W]e have to realize polling error has been far more pronounced in presidential elections, especially those with Donald Trump on the ballot,” they write, “so we should be careful not to overcorrect for an error that may be geared to one man.”
This is an important question, for obvious reasons. If Trump’s ability to turn out voters broke the ability of pollsters to measure likely outcomes, it hardly absolves polling, but it does decrease the likelihood that polls will similarly err in the future. (We should note, by the way, that the narrative that the polls were all wildly off the mark in 2020 is itself somewhat inflated.)
This is all hard to measure, for a variety of reasons. The pollsters themselves downplay the idea that they simply missed a surge of Trump voters by pointing out that their turnout models — the expectations they had for who would vote — were themselves accurate. If that’s the case, it means that the responses they got from their polling itself poorly measured sentiment. (To oversimplify: If you know that you polled more White people than are likely to vote, you can weight your results to reflect who you expect to show up at the polls. But if you’re polling a group of White people who offer responses that don’t reflect the population overall, your results will be off the mark even when weighted.)
I’d been meaning for a while to see if I could find data that spoke to the idea that Trump voters were different from Republicans overall. With the help of Washington Post data guru Lenny Bronner and a voter file from the data firm L2, I got two sets of data: the number of currently registered Republicans who voted in 2016 and 2020 and the number who voted in 2016, 2020 and either 2014 or 2018. In other words, two groups in each county: those who only voted when Trump was on the ballot and those who voted in midterms, too. (In states that don’t register voters by party, we used L2′s modeled party identity.) In each county, I took the difference between those groups — non-midterm voters, since the 2016-and-2020-only pool was larger — and compared it to the Republican vote total in the county last year.
There are a lot of caveats that apply here, but one interesting pattern did emerge. In counties that voted more heavily Republican, the number of voters who didn’t vote in midterms was, on average, a higher percentage of the number of Republican votes. In other words, Trump-only voters made up a higher percentage of the total. In rural counties, that effect was larger.
Bear in mind, these aren’t new voters. These are voters who voted in both 2016 and 2020, meaning that they could certainly have voted in 2018, too. But in places where Trump did better, a greater density of the 2020 voters tended to have skipped the midterms.
This is a very rough calculation, admittedly. If we plot each rural county (using Pew Research Center’s designations), you can see how messy the results are. But you can also see the trendline.
This doesn’t prove that Trump was dependent on voters who only came out to vote for him. All it does is provide one more bit of data suggesting that it might be the case that his candidacy had an unusual effect, particularly in more rural areas. (There’s a correlation between population density and college education. In rural counties, an average of 20 percent of White adults have degrees; in large urban counties, the average is 45 percent.)
What it does, in essence, is serve as another reminder that I need to change that battery.