Spiking gas prices have weighed on motorists in every state this year, making daily life more expensive in myriad ways. But the burden has not been evenly distributed.
Why gas is so expensive in some U.S. states but not others
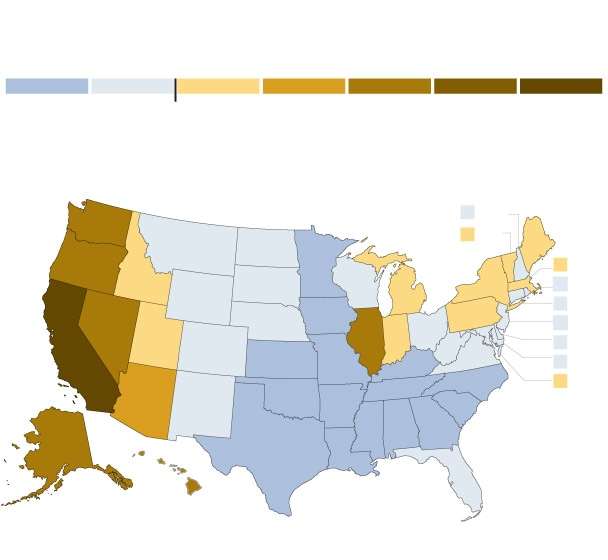
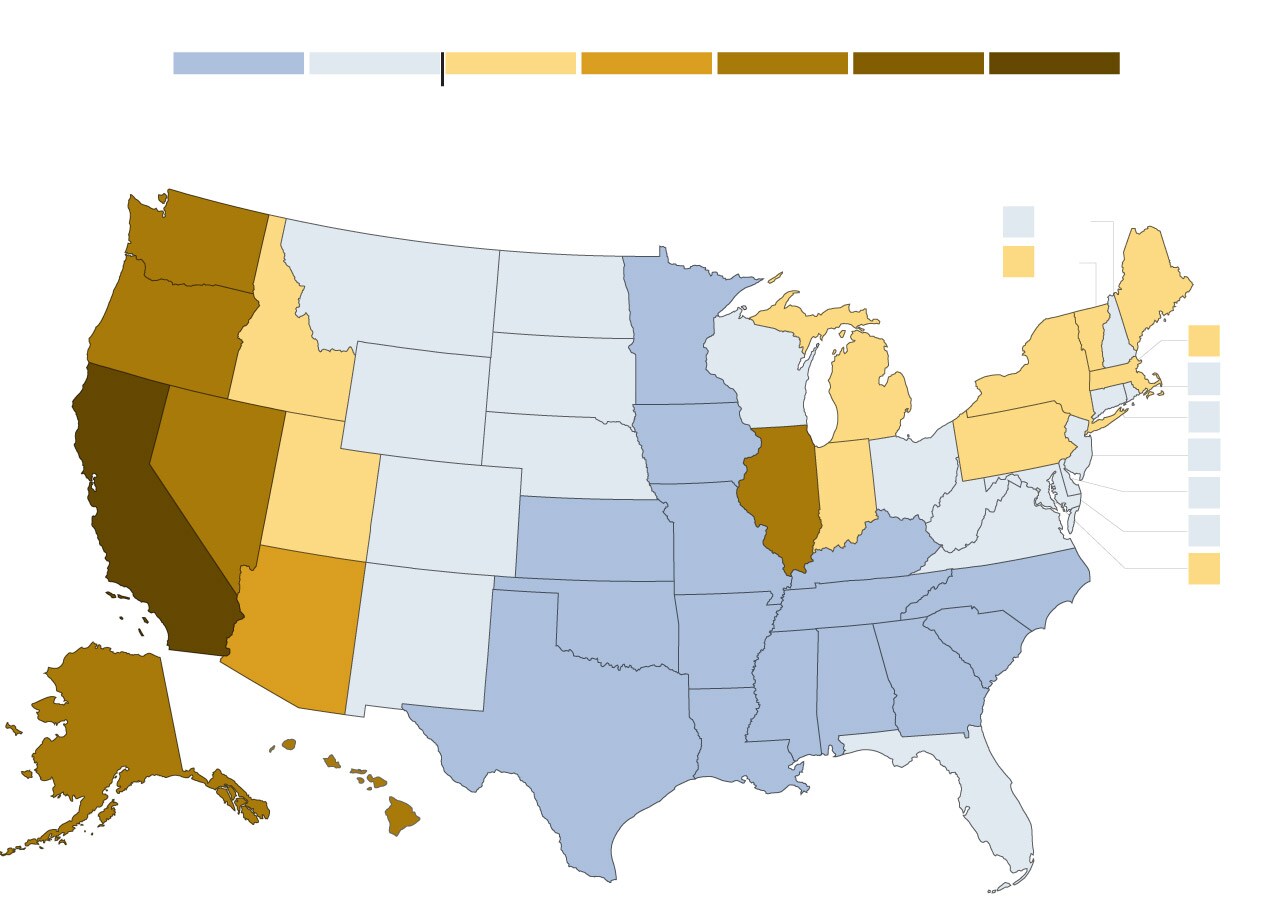
How gas prices compare to the
national average
National
avg.
Data as of June 19
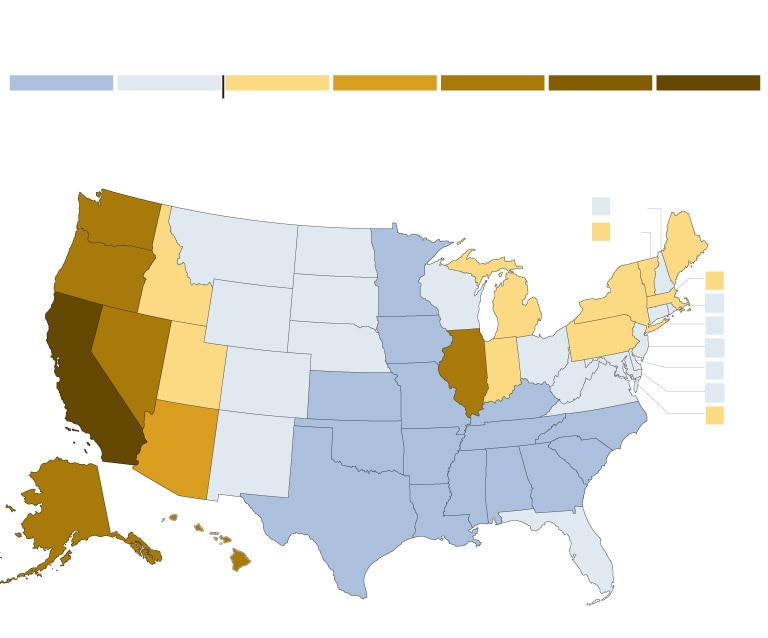
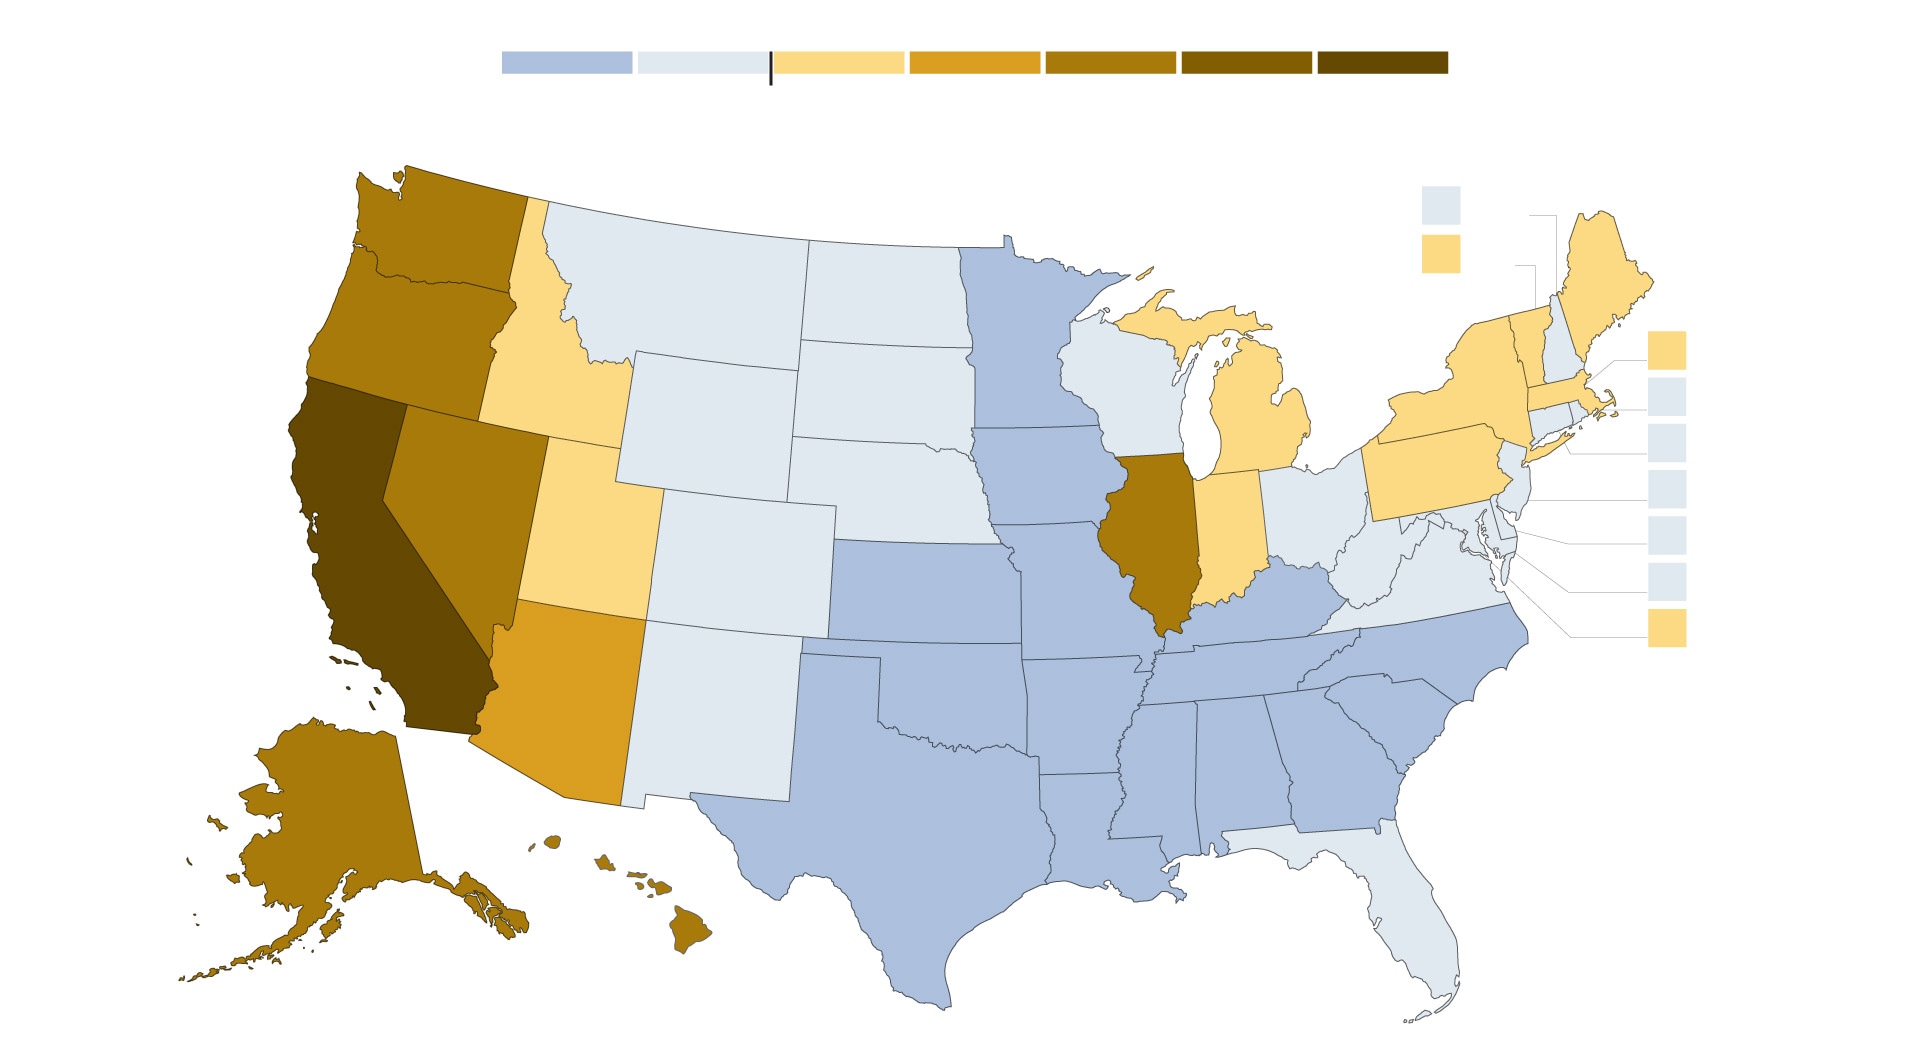
How gas prices compare to the
national average
National
avg.
Data as of June 19
How gas prices compare to the national average
National
avg.
Data as of June 19
How gas prices compare to the national average
National
avg.
Data as of June 19
So why do gasoline costs differ so much from one area to the next? Economists attribute it to an array of forces related to supply chains, the local cost of doing business, taxes and environmental policy, among other factors.
Crude oil is a global commodity, whose prices are set by supply and demand. But it also has to be transported to a refinery, processed and then shipped to individual fuel stations, which have operating costs of their own. Each link in that chain is reflected in what consumers pay at the pump, and that cost varies significantly depending on the location.
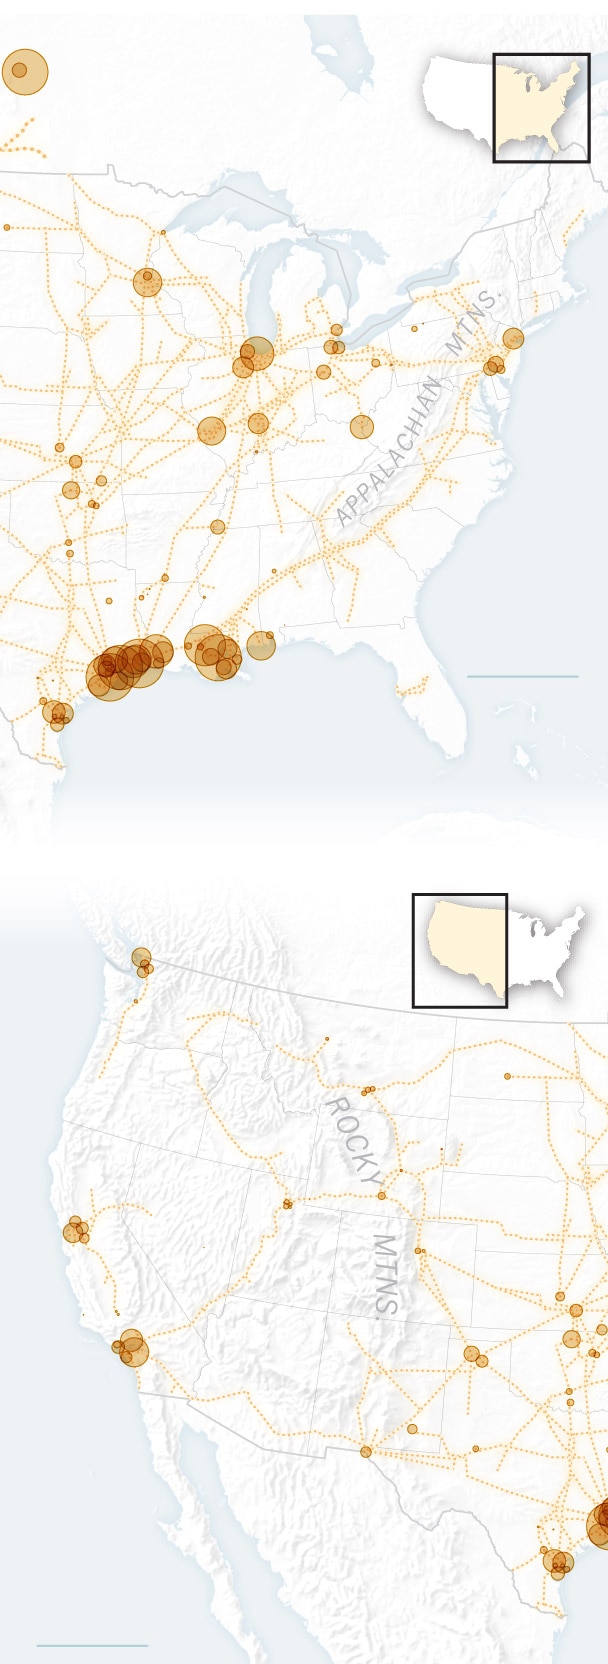
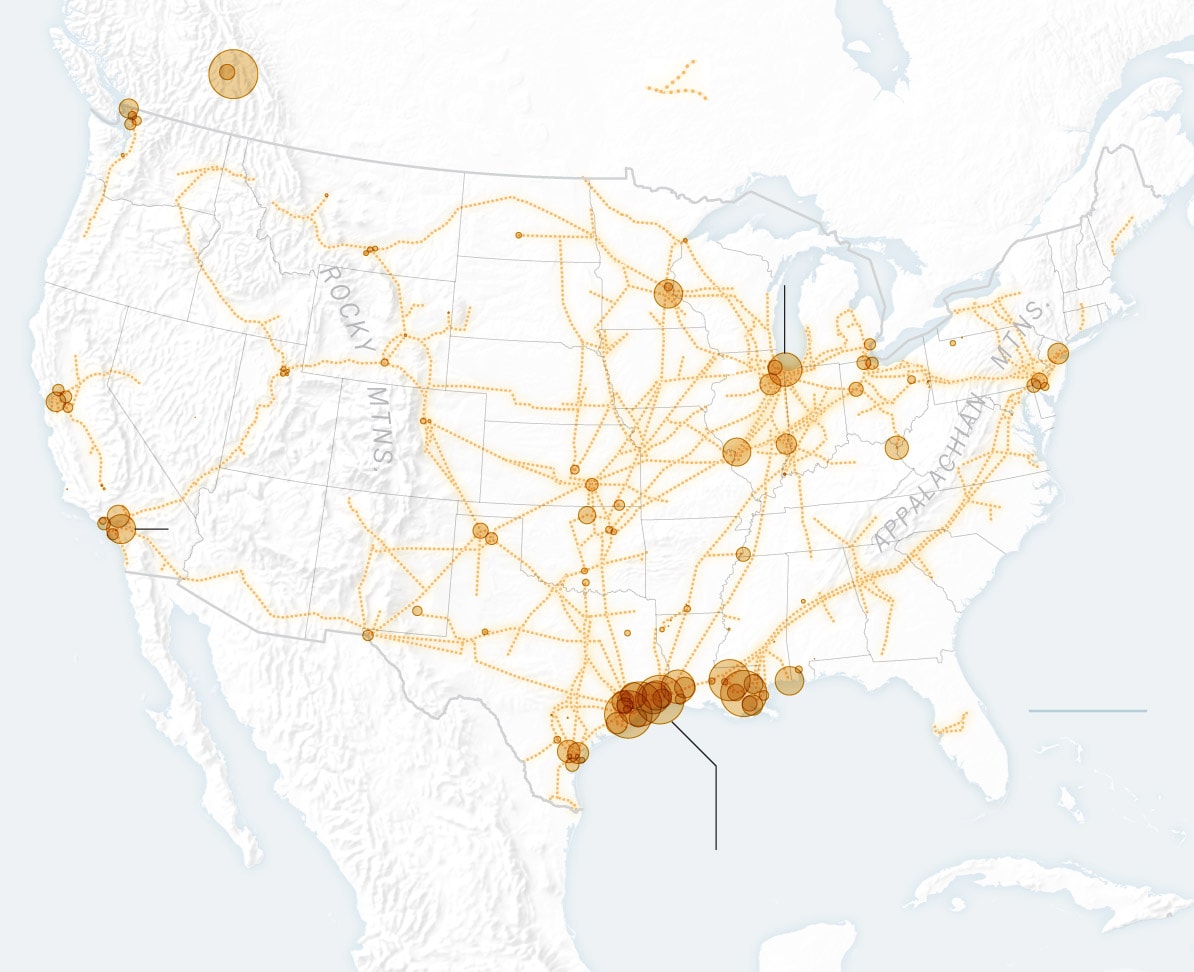
Supply sources for transportation fuels
Petroleum refineries
(scaled by processing capacity)
Petroleum product pipeline
Atlantic
Ocean
New
Orleans
Corpus
Christi
Gulf of Mexico
The Gulf Coast is the largest domestic supplier
of transportation fuels with just over half of
total U.S. refining capacity.
Salt Lake
City
Los
Angeles
Pacific
Ocean
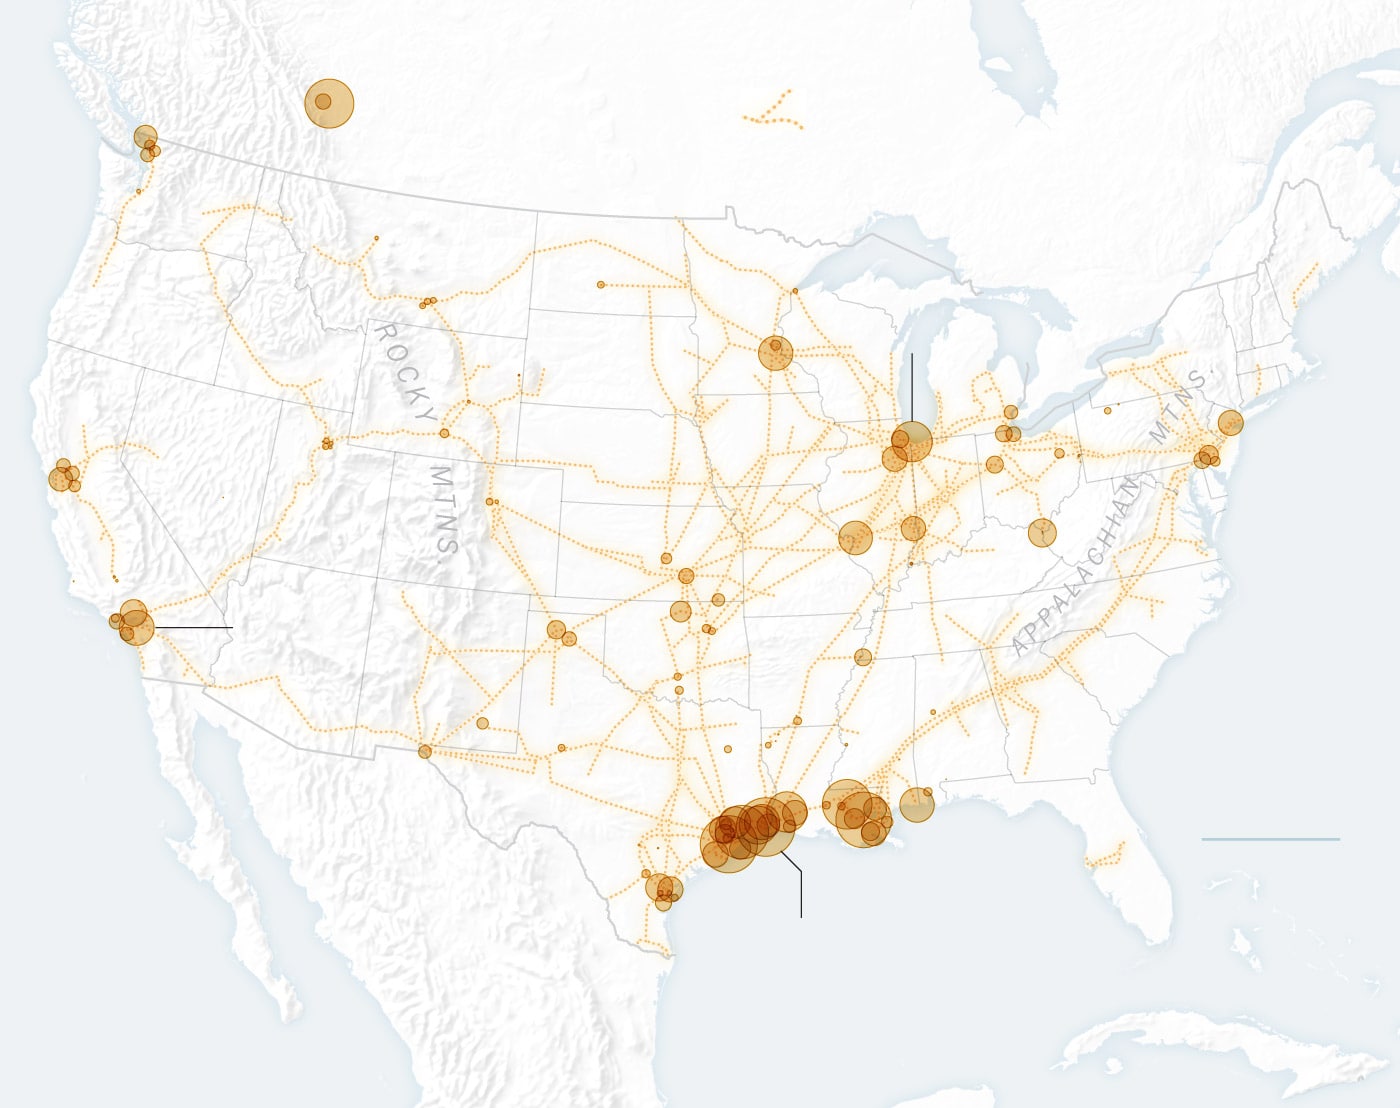
Supply sources for transportation fuels
Petroleum refineries
(scaled by processing capacity)
Petroleum product pipeline
Atlantic
Ocean
New
Orleans
Corpus
Christi
Gulf of Mexico
The Gulf Coast is the largest domestic supplier of
transportation fuels with just over half of total
U.S. refining capacity.
Salt Lake
City
Los Angeles
Pacific
Ocean
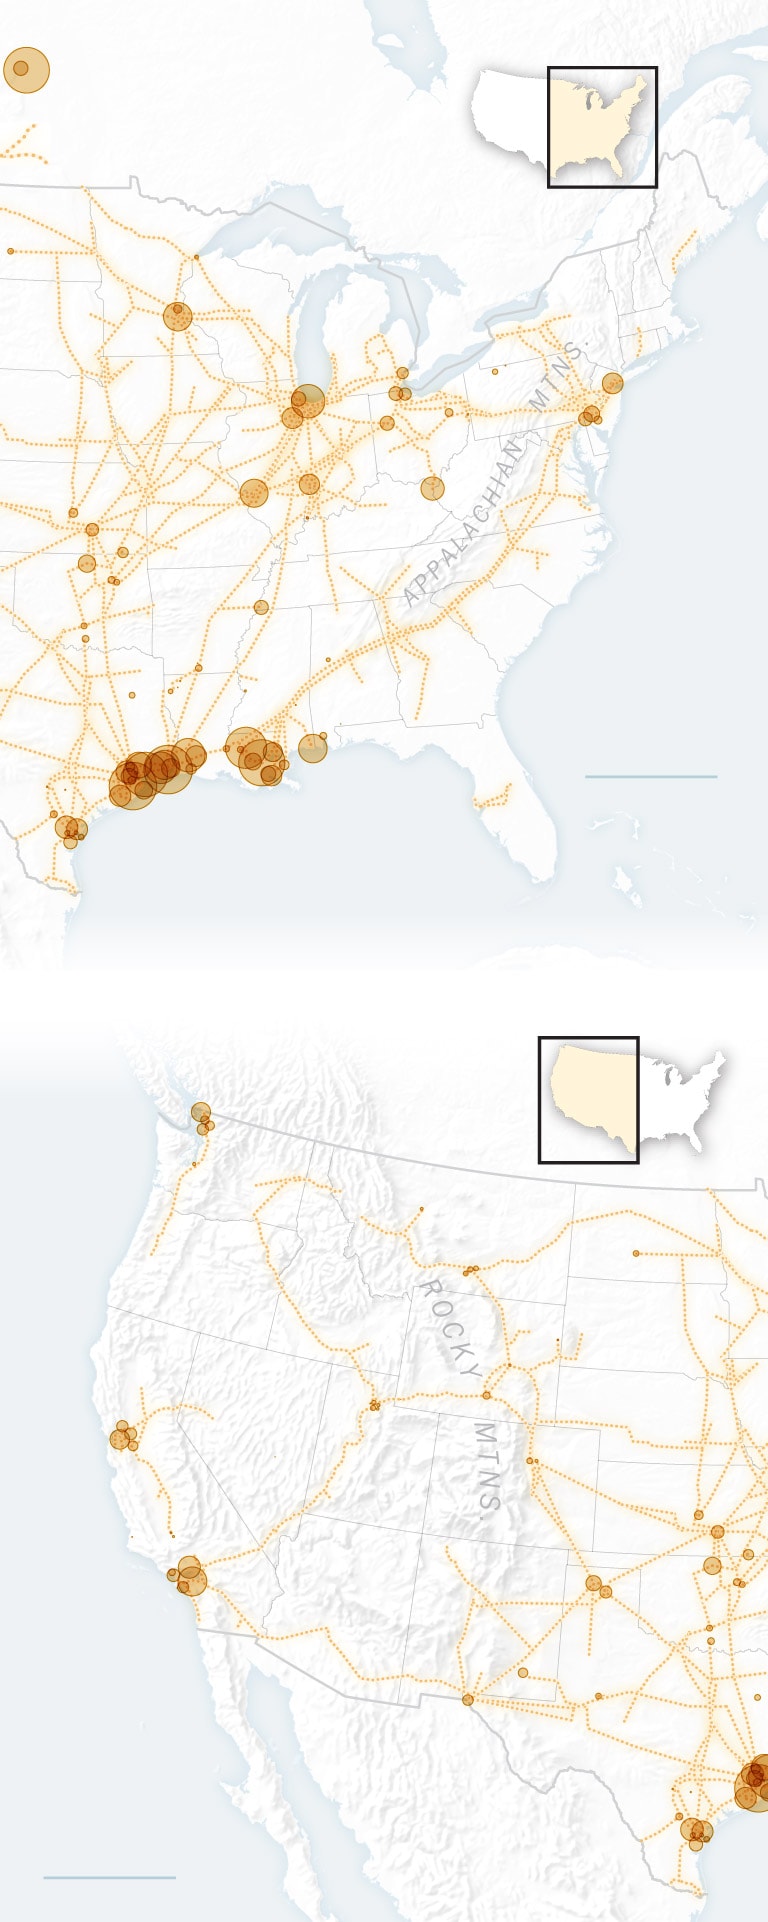
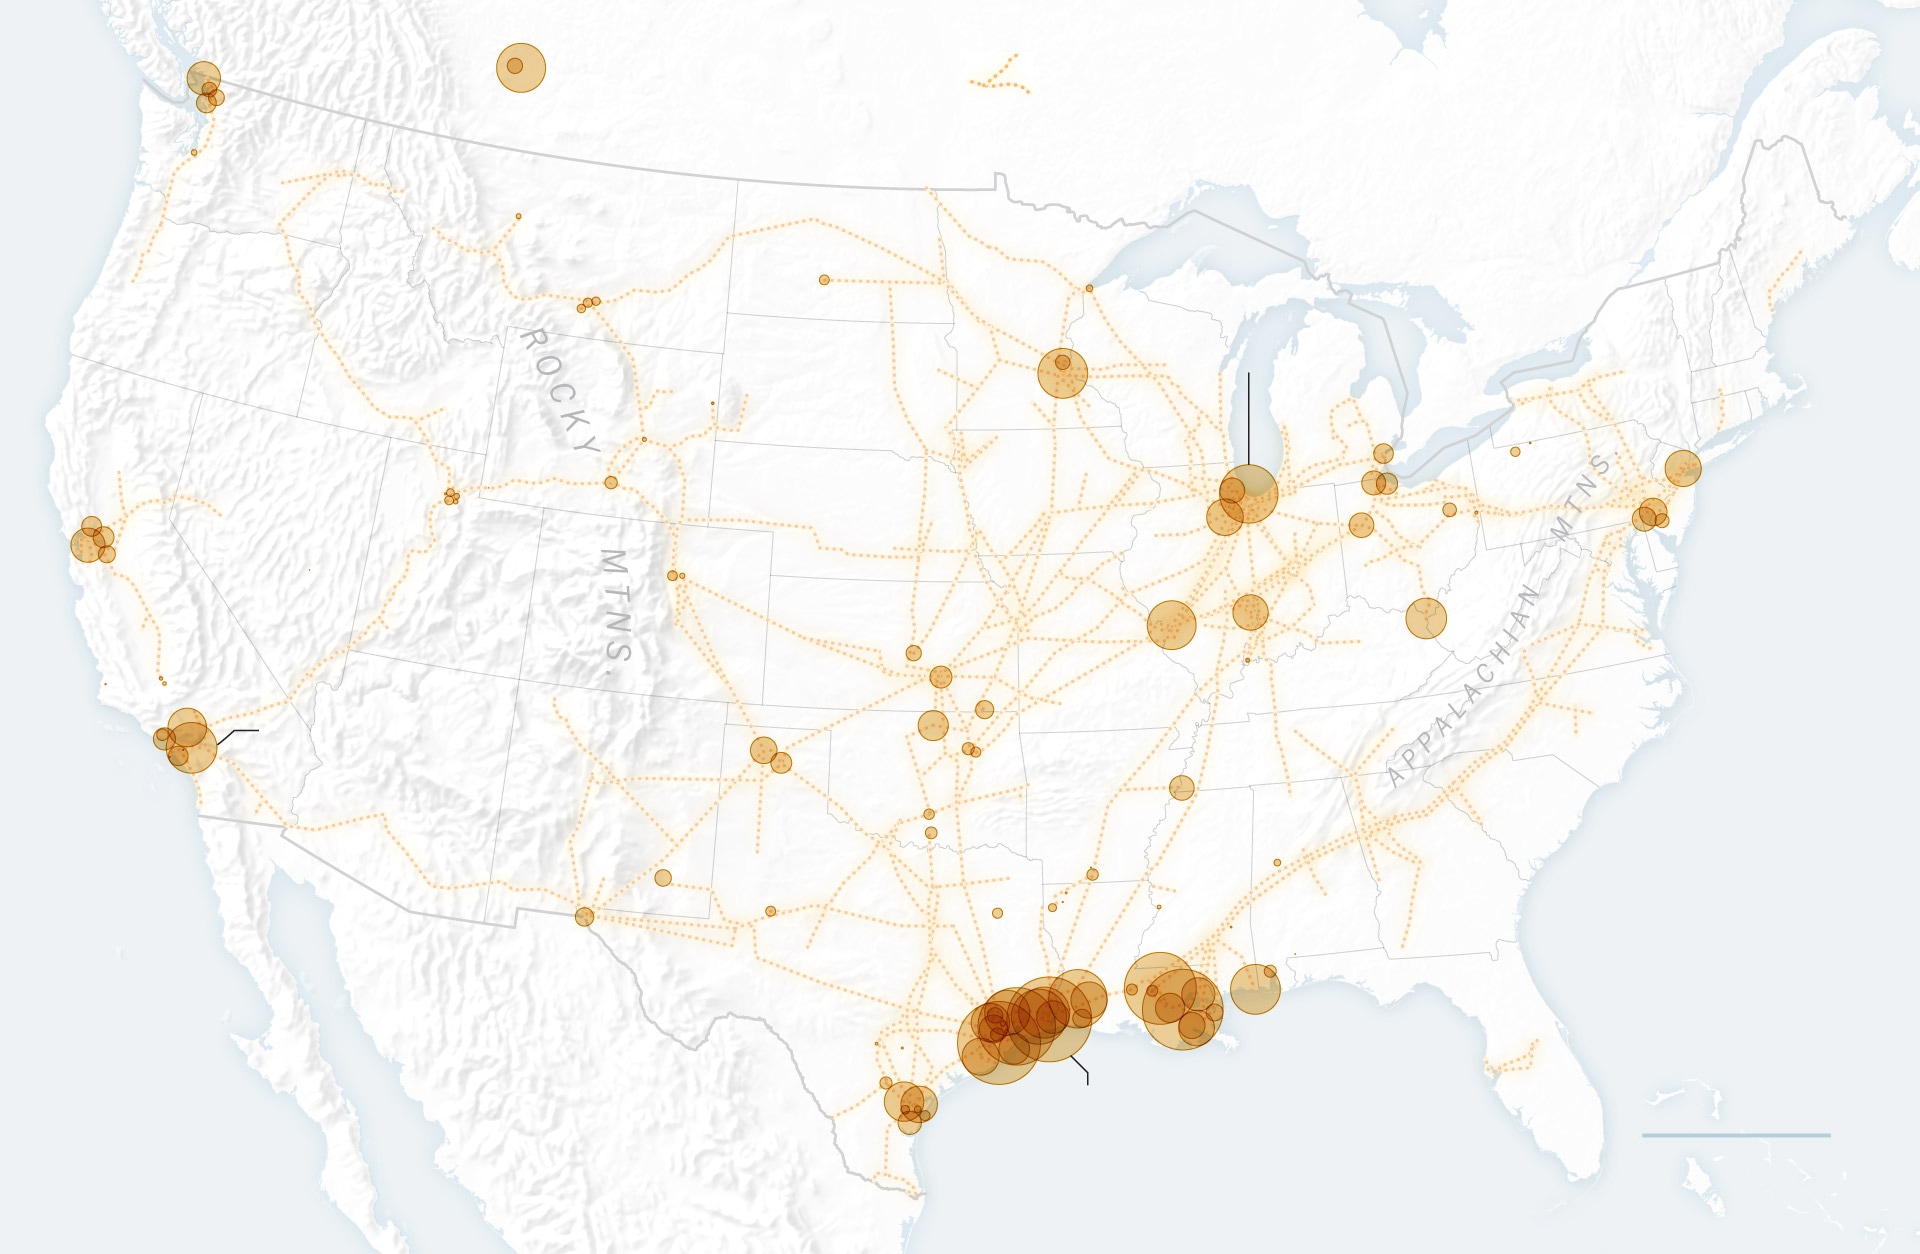
Supply sources for transportation fuels
Petroleum refineries
(scaled by processing capacity)
Petroleum product
pipeline
Whiting, Ind.
440,000 barrels per day
Salt Lake
City
Linden, N.J.
272,000
barrels per
day
Carson, Calif.
382,000 barrels per day
Los
Angeles
Atlantic
Ocean
Pacific
Ocean
New
Orleans
Corpus
Christi
Gulf of Mexico
The Gulf Coast is the largest domestic
supplier of transportation fuels with just
over half of total U.S. refining capacity.
Port Arthur, Texas
Largest U.S. capacity:
639,000 barrels per day
Supply sources for transportation fuels
Petroleum refineries
(scaled by processing capacity)
Petroleum product
pipeline
Whiting, Ind.
440,000 barrels per day
Salt Lake
City
Linden, N.J.
272,000
barrels per day
Carson, Calif.
382,000 barrels
per day
Los
Angeles
Atlantic
Ocean
New
Orleans
The Gulf Coast is the
largest domestic supplier
of transportation fuels
with just over half of total
U.S. refining capacity.
Corpus
Christi
Port Arthur, Texas
Largest U.S. capacity:
639,000 barrels per day
Pacific
Ocean
Gulf of Mexico
Supply sources for transportation fuels
Petroleum refineries
(scaled by processing capacity)
Petroleum product pipeline
Whiting, Ind.
440,000 barrels per day
Salt Lake
City
Linden, N.J.
272,000
barrels per day
Carson, Calif.
382,000 barrels per day
Los Angeles
Atlantic
Ocean
The Gulf Coast is the largest domestic
supplier of transportation fuels with just
over half of total U.S. refining capacity.
New
Orleans
Port Arthur, Texas
Pacific
Ocean
Corpus
Christi
Largest U.S. capacity:
639,000 barrels per day
Gulf of Mexico
The bulk of U.S. refining capacity is along the Gulf Coast, particularly Texas and Louisiana, said Pavel Molchanov, director and equity research analyst at Raymond James, an investment bank and financial services company. A gas station located far away from a refinery can expect a hefty markup, he says.
“Delivering gas in Texas is obviously cheaper because the refineries are right there,” Molchanov said. “In places where there are no refineries, the fuel needs to be delivered maybe thousands of miles, and that costs more.”
The East Coast, for example, benefits from a vast network of pipelines that carries gasoline and jet fuel; the largest is Colonial Pipeline, which stretches from Houston to New York. But that setup cannot be replicated on the West Coast because the Rocky Mountains prevent similar access to Gulf Coast refineries.
Taxes also play a key role: All motorists pay a federal gasoline tax of 18 cents a gallon, but states tack on their own levies, which generally are used to fund infrastructure projects, and they can vary significantly.
West Coast drivers pay some of the highest state fuel taxes in the country, according to the Federation of Tax Administrators. That comes to nearly 57 cents a gallon in California, 49 cents in Washington and 38 cents in Oregon.
But the highest state tax rate belongs to Pennsylvania, at 58 cents per gallon. The lowest can be found in Alaska, at about 9 cents.
As fuel prices have climbed, some states, including Florida, New York and Georgia, have paused their gasoline taxes.
Clean energy regulations can increase costs at the state and local level. Regulations governing the mix of chemicals referred to as “gasoline” mean gas stations have to pay more in some states to serve cleaner-burning fuel.
California’s Air Resource Board, for example, maintains a raft of requirements applying to the specific formulation that gas producers and importers can sell in the state, applying strict rules to chemicals like benzene, formaldehyde and sulfur. As a result, the state imports a lot of Middle Eastern gas, according to GasBuddy’s head of petroleum analysis, Patrick De Haan.
“California is a petrol island, if you will,” De Haan says.
Regulations on so-called cleaner-burning gasoline, or CBG, also can come into play within individual states. Arizona’s retail compliance standards for gasoline place tighter restrictions on Phoenix and the surrounding area, for example, while Tucson and other parts of the state have less stringent requirements.
Gasoline in Maricopa County, where Phoenix is located, runs nearly $5.70 a gallon, on average. But it remains under $5 in neighboring Yuma and Pima Counties.
Data on national and state gas prices comes from AAA. Petroleum refinery and pipeline locations, along with processing capacity, are from the U.S. Energy Information Association. Processing capacity is as of Jan. 1, 2021 and reported in barrels per stream day, or the maximum amount a refinery could produce if it ran at full capacity all day. State tax rate data was provided by the Federation of Tax Administrators.
Source: WP