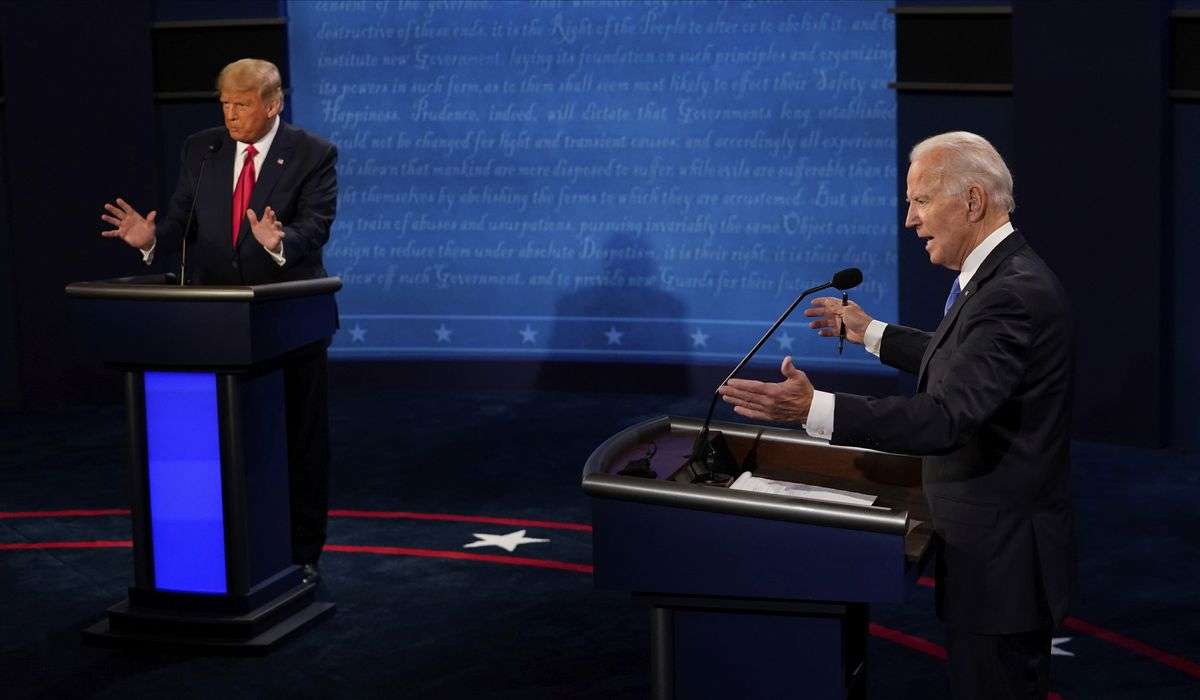
It’s important to ask why 2020 polls were off. It’s more important to ask what will happen next.

That this happened four years after Trump’s surprise 2016 win was jarring and, predictably, has led to preliminary examinations of what may have gone wrong. But there’s a more important question to answer: What will happen now?
To answer that, we should begin by assessing what happened. So:
What happened
A key point is that we’re still not entirely certain what happened. Votes are still being counted in several states, including California and New York. The final tally will shift the national margin in Biden’s favor substantially.
That was also true on the night of the election. Vote totals shortly after polls closed in several states misrepresented the eventual margins. In Pennsylvania, for example, Trump had a large lead within a few hours of polls closing. This was a function of the state counting in-person votes cast that day before it counted mail-in ballots. The day-of votes heavily favored Trump; the mail-in ballots heavily favored Biden. Over the next five days, the state counted more and more mail ballots and Trump’s apparent lead shrank and shrank. Eventually, it became clear that Biden would win the state. He leads by about a percentage point.
FiveThirtyEight’s final average in the state, though, had Biden winning by nearly five points. The average was off by about four points — not great, although better than it looked on the evening of Nov. 3.
We can use FiveThirtyEight’s averages (which are averages of existing polls, not FiveThirtyEight’s own surveys) to evaluate how polling in 2020 compared with where we expect state results to land. It’s also useful to do the same for 2012 and 2016 to show how past errors have looked.
When we do that, we see a recurring pattern and a recent trend. The pattern is that there’s a correlation between the final result in a state and how much the polls were off. Bigger wins, bigger misses, largely because states with more obvious outcomes had fewer polls conducted. The trend is that polling errors have underestimated Republican support over the past two cycles.
It’s interesting to use 2012 as a baseline because, that year, polls expected President Barack Obama to fare worse both at the state and national levels. The surge in 2008 that brought Obama to the White House receded in 2010, with him not on the ballot. Pollsters thought 2012 might look similar but, instead, there was another (albeit smaller) surge.
On average, state polls in 2020 predicted margins that probably will end up being a bit under five points more favorable to Biden than the actual result, as of writing. That probably will shift as state results are finalized. The national margin probably will also shift further, given how many outstanding ballots there are in large blue states such as California and New York. (We explain the math at the end of the article.) But most state polls overstated Biden’s position (45 of them, as of writing), a bigger imbalance than in 2016 (when 38 overstated Democratic nominee Hillary Clinton’s) or 2012 (when 35 overstated Republican nominee Mitt Romney’s position).
The Post’s polls with ABC News were among those which at times overstated Biden’s state-level support, including in our last poll in Wisconsin. Polls in Pennsylvania and Michigan did so to a lesser degree, while our polls in Florida, North Carolina and Virginia (with George Mason University’s Schar School) were quite accurate.
Three other points are worth making here.
The first is that poll inaccuracies were not unexpected, although the apparent scale was. Given what happened in 2016, there was awareness that endemic problems may still exist, leading to analysis accommodating possible errors. FiveThirtyEight’s projection that Biden was likely to win incorporated the likelihood of error. The challenge was that the effort to address the known problem wasn’t as effective as hoped.
The second point worth making is that presidential polling wasn’t the only concern in this election cycle. A number of House and Senate races also missed the mark, complicating analysis of the causes underlying the issue. Particularly given the third point: Polling during the midterm elections two years ago was quite good. It’s possible, then, that the 2016 to 2020 stretch somewhat mirrored the 2008 to 2012 period.
Why it happened
Perhaps the best analysis of polling in 2020 came from Pew Research Center last week. Among other findings, it determined that polling in the Upper Midwest was more likely to overstate Biden’s support than polling in the Sun Belt, in line with The Post’s results.
“The fact that the polling errors were not random, and that they almost uniformly involved underestimates of Republican rather than Democratic performance, points to a systematic cause or set of causes,” Pew’s researchers wrote. “At this early point in the post-election period, the theories about what went wrong fall roughly into four categories, each of which has different ramifications for the polling industry.”
Two of the theories presented by Pew focus on the modern right as it exists under Trump.
One is that Trump supporters were less willing to acknowledge to pollsters that they supported the president, what has come to be known as the “shy Trump voter” theory. Pew notes that there has been a great deal of research done on this theory, which was first presented before 2016, without finding evidence of such an effect.
More interesting is the idea that Trump’s broad rejection of institutional actors, including the media and pollsters, may have made Republicans — or Trump’s most fervent base of support — significantly less likely to respond to pollsters. If a pollster calls on behalf of The Washington Post, in other words, might those who accept Trump’s disparagement of the newspaper be less likely to talk?
The two other theories from Pew focus on how pollsters try to predict who’s going to turn out. To estimate the outcome of a contest, pollsters have to develop an estimate of who’s likely to vote. After all, if a poll shows a 50-50 race between a Democrat and a Republican but only Republicans are going to cast ballots, that affects how the results should be presented.
One theory is that pollsters failed to capture Trump supporters who ended up voting. This could be because they were first-time voters, reflecting the campaign’s big voter registration push. It could simply be because they were infrequent voters motivated mostly by Trump. Another theory is that the coronavirus pandemic prompted Democrats to scale back their traditional turnout operation. Given the surge in turnout nationally, the latter seems less likely than the former.
Again, though, it’s tricky to reconcile these theories with, for example, the reelection of Sen. Susan Collins (R-Maine). Polls consistently showed her even with or trailing her opponent. She won by nearly nine points, almost as big a margin as the one by which Biden won Maine. Was this its own polling miss? Related to the national problems? It’s hard to say.
In the weeks before the election, several pollsters argued that they had cracked the code, positing bigger Trump margins than polling averages showed. One, Trafalgar Group, made the rounds in the media arguing that its black-box methodology showed Trump winning most states he’d won in 2016. Its final map had Trump losing Wisconsin but winning Nevada. Although its past seven state polls were, on average, two points off the mark to Biden’s detriment, it was incorrect about five states. (By contrast, FiveThirtyEight’s averages missed only Florida and North Carolina.) Its last polls overstated Trump’s position in Georgia and Michigan by five points.
Now what?
After it became clear that Trump would win Florida — and well before we had a sense of how Michigan and Pennsylvania would turn out — there was a quick push against the perceived failure of the polls to capture the outcome. FiveThirtyEight in particular was singled out as having erred by giving Biden a 90 percent chance of winning based on the polling.
Part of this was the quadrennial continuation of a tension in the media that emerged with the ascent of FiveThirtyEight’s Nate Silver in 2008. Silver helped popularize polling averages and correctly identified the likely outcomes in 2008. In 2012, when many pollsters and pundits predicted a slight advantage for Romney, Silver argued, correctly, that Obama was a clear favorite. This earned him no shortage of professional opponents who were happy to crow about the failure of polling to predict the 2016 outcome. In the wake of this year’s election, there was some similar celebrating of the apparent triumph of individual and anecdotal reporting over what surveys suggested would happen.
There are two significant problems with that argument.
In 2016, FiveThirtyEight was actually one of the outfits offering the most robust pushback against the perception that Clinton would almost certainly win. This year, the race ended up being closer than expected but it wasn’t terribly close. Biden won with some breathing room. It’s hard to conceptualize a 9-in-10 chance of winning something beyond “very likely to happen,” but Biden’s flipping of five states seems like he landed somewhere north of 50-50 odds.
The other significant problem is that the response to “errors exist within a system predicated on a scientific process” isn’t “we should embrace an unscientific process.” It is “we have to fix the process.”
That’s really the thrust of the Pew assessment: figuring out what went wrong to figure out how it can be fixed. Saying that polling errors in 2020 mean that we should prioritize man-on-the-street interviews and punditry about crowd sizes is a bit like saying that the failure of an antibiotic to cure an illness means we should revert to trying to balance a patient’s humors.
This is part of the reason that Trafalgar’s assessments were so dubious. The pollsters declined to explain how they reached their estimations, hinting at some secret-sauce methodology that they presented as necessarily better. Mix in their chief pollster’s frequent reiteration of Trumpian conspiracy theories and how his predictions deviated from the results, and it’s hard to operate from the assumption that they’ve cracked any polling code.
Here we get into an important but frustrating reality. Polling isn’t built to be an instrument that correctly identifies the winner in a race that comes down to one or two percentage points. It’s meant to roughly evaluate the views of a population with predictable margins of error. Those margins are reduced when polls are averaged, but we tend to expect more from presidential polls than they are built to offer.
That’s compounded when considering the gap between measuring voting preferences and the electoral college, the actual system for choosing presidents. Polling that showed Clinton beating Trump by five points nationally in 2016 was more accurate than national polling showing Trump winning the election, for example, because the former was closer to the national result. Showing Trump winning by accident — or by design — isn’t good polling.
No pollster, certainly including The Post, was perfect in its assessments of likely outcomes in 2020. None should expect to be. The questions now are twofold: How anomalous were 2016 and 2020, and to the extent that they weren’t anomalous, how does polling accommodate the reasons for the polling errors? Both of those questions will take time to answer.
But we can reject one answer out of hand. The best answers will come from open discussion and research about what happened, not from giving up on polling or from mixing private, subjective factors into estimated results.
And pollsters can point to at least one brightish spot: Biden was predicted to win and he won. On the issue that Americans cared about the most, the polls got it right, if only in the broadest strokes.
The state-level and national results included above are estimates of outstanding votes using existing margins. As of writing, for example, Biden leads Trump by 3.6 points nationally, 4.8 points better for Trump than the final national polling average. If every estimated outstanding vote matches existing county-level results, we land at a 4.8-point Biden win nationally and a poll miss of 3.8 points. But if the outstanding votes are more heavily Democratic than the votes that are in — a safe assumption — the final miss will be narrower still.

