“The numbers speak for themselves: Nearly 90% of student loan debt relief will go to borrowers earning less than $75,000; 85% of the congressional Republicans’ tax cut went to taxpayers earning more than $75,000.”
The White House’s tricky comparison between student loan relief and GOP tax cuts

Households earning at least $250,000 a year — and individuals earning at least $125,000 — would be eligible to have up to $10,000 in student-loan debt canceled (up to $20,000 in the case of Pell Grants for low-income students). Parents who took out direct loans known as Plus would also be eligible, in addition to their children.
In this tweet, the White House contrasts its plan with the across-the-board tax cut passed by Republicans in 2017. The suggestion is that President Biden’s plan is targeted directly at the middle class, in contrast to a GOP tax plan that supposedly showered money on the wealthy.
There’s a reason $75,000 is so attractive to the White House. The Census Bureau says median household income is close to $70,000. But these numbers are measuring different things, and so they are not directly comparable.
White House student loan statistic
The White House has heavily emphasized its claim that much of the loan forgiveness would go to people making less than $75,000.
A chart appears in the White House fact sheet claiming 87 percent would go to people making less than $75,000, 13 percent would go to people making between $75,000 and $125,000, and zero percent would go to people making more than $125,000.
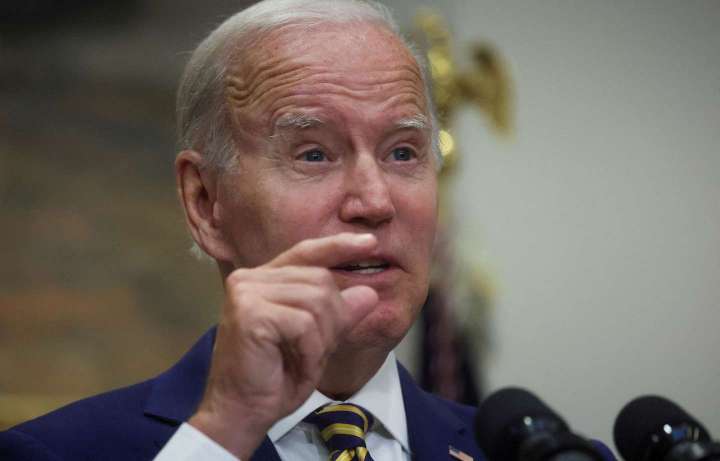
In his remarks announcing the plan, Biden said, “About 90 percent of the eligible beneficiaries make under $75,000 a family.”
Actually, Biden got that wrong. The chart says that the numbers reflect “individual income,” not family income. The official transcript has not been corrected, but perhaps Biden was confused, because usually such distribution tables are based on household (family) income. Instead, the White House rendered the statistics as individual income.
Imagine a family in which the husband and wife each make $75,000. That’s household income of $150,000. They likely would file a joint tax return. But under the White House scenario, each person is treated as an individual.
White House officials said they relied on an analysis done by the Education Department that studied individual income data from the Census Bureau and used what they claimed was more robust student loan data than provided by the Federal Reserve’s Survey of Consumer Finances (SCF). The Education Department calculated the distribution based on the characteristics of people who have taken out student loans.
Thus far, a full distribution table or the methodology has not been released, only the White House chart — a fact that makes it hard to evaluate. Some analysts question how the distribution estimate captures rapidly changing incomes from 2020 and 2021 to 2022 — and the “lifecycle effects” of people as they age. Another issue is how the loan-forgiveness benefit is calculated from canceling a $10,000 income-driven repayment (IDR) loan — in which someone might only expect to pay less than half of that amount over the life of the loan. Under IDR loans, borrowers pay a monthly percentage of their income for a set period of time.
Meanwhile, the Penn-Wharton Budget Model, in evaluating the distributional impact of the student loan plan, used household income. White House officials confirmed there is no phaseout of the income limits, just a cutoff at $125,000 per individual or $250,000 per household. In doing the analyses, Penn-Wharton assumed there was no phaseout.
For student loans, the Penn-Wharton model relies on public Education Department data and uses the Fed’s data just for income distribution and thresholds, according to Kent Smetters of University of Pennsylvania’s Wharton School.
The extra $10,000 for the Pell Grant is the main source of progressivity in the Biden plan, Smetters said, but that is mostly tied to parent’s income, complicating the analyses and possibly making the Biden plan appear more progressive than it really is. Penn-Wharton hopes to refine the analysis in the coming weeks once it receives permission to use confidential National Center for Education Statistics.
Remember how the White House says zero percent would make more than $125,000? The Penn-Wharton model found that about 1 percent of households with debts canceled would make between $212,209 and $321,699 in fiscal year 2022. About 5 percent would make between $141,096 and $212,209.
The Penn-Wharton model generally displays distribution results in quintiles. But at the Fact Checker’s request, Smetters ran the numbers so we could make a direct comparison to the White House figures. He said that 66.13 percent of households receiving loan forgiveness would have income below $75,000; for ages 25-35, 62.04 percent would have income below $75,000. Penn-Wharton said most of the debt forgiven would accrue to borrowers in this age range.
In other words, at least a third would make more than $75,000. That’s a different picture than what the White House presented.
White House officials argued that when using household data, a direct comparison should be at the $150,000 level — double the $75,000 in the chart. Smetters ran the numbers again. By that standard, about 95 percent of the loan cancellation benefits would go to households making less than $150,000, he said. For ages 25-35, he said, about 93 percent of benefits would go to households making less than $150,000.
GOP tax plan statistic
Meanwhile, the statistic about the GOP tax plan — “85% of the congressional Republicans’ tax cut went to taxpayers earning more than $75,000” — is based on household income, not individual income. The White House said this number comes from an Urban-Brookings Tax Policy Center (TPC) calculation from 2018, showing the share of the total federal tax change.
It’s worth noting that the Tax Policy Center uses a concept called expanded cash income, which includes as part of income such items as employer contributions for retirement plans, health insurance, and payroll taxes, as well as government cash transfers such as food stamps. These items could push some households into higher income categories. Penn-Wharton does not include such items, and neither does the Census Bureau. (The White House fact sheet linked to the Census Bureau when discussing the income limits.)
The TPC analysis shows that taxes were cut at every income level in the 2017 bill. The Congressional Budget Office, in a 2021 report, also found that “provisions included in the 2017 tax act reduced average federal tax rates among all quintiles in 2018.”
As we often note, since the wealthy pay most of the income taxes, they end up with most of the tax cuts in any across-the-board tax cut.
“Households in the highest income quintile, which received about 55 percent of all income, paid more than two-thirds of all federal taxes in 2018,” the CBO estimated. “In contrast, households in the lowest quintile, which received about 4 percent of all income, paid about 0.01 percent of federal taxes, on net, in that year.”
In any case, the White House distribution table for the student loan relief is based on individual income, while distribution claimed for the GOP tax cut is based on household income.
White House officials said that even when using household numbers, the student-loan plan compares favorably to the GOP tax cut. The bottom four income quintiles (under $141,000 in household income in the Penn-Wharton model) are projected to receive 94 percent of the student loan relief, one official noted. By contrast, the TPC analysis of the Republican tax law found the bottom four quintiles (under $149,000 in expanded cash income) received 36 percent of federal tax cuts.
The Pinocchio Test
Someone in the White House thought it would be clever to have a snappy comparison between the student loan plan and the GOP tax cut. But it’s not kosher to compare individual numbers with household numbers. That’s apples and oranges.
Broadly speaking, the student loan forgiveness is more progressive than the tax cut. But notice what happens when the analysis is apples to apples — household income of about $150,000: The student loan plan ends up benefiting about 95 percent of those under that income level — but the tax cut benefited more than 35 percent. That contrast works in the White House’s favor — but it’s not nearly as stark as before.
Two Pinocchios
Send us facts to check by filling out this form
Sign up for The Fact Checker weekly newsletter
The Fact Checker is a verified signatory to the International Fact-Checking Network code of principles


